
We introduce a practical, repeatable method to see if a device is working properly in real rooms, not just on paper. This short guide is for flats, landed homes and small office meeting rooms in Singapore.
First, we set realistic expectations for home-based testing and note what needs lab work. Then we outline a two‑layer process: quick practical checks and measurement-led verification using a quality monitor.
Our fast checks cover airflow, noise and filters. Measurement checks use baseline‑then‑on tests and metrics such as CADR, CCM and PM2.5, plus HCHO, TVOC and CO2 readings.
We explain why “feels fresher” is not enough. Observable, repeatable indicators help us decide on filter changes, repositioning and run time, cutting wasted hours and improving results across different models and products.
Why performance checks matter for clean air in Singapore homes and offices
We work in tight, often closed spaces in Singapore. That makes routine verification important for real-life results. Quick, repeatable tests tell us if our setup is truly improving clean air where people spend time.
What we can and cannot judge with our senses
We can notice odours, smoke or strong cooking smells. These clues prompt action.
We cannot reliably sense PM2.5, ultrafine particles or low-level formaldehyde. Many harmful pollutants are invisible and only show up on monitors.
Typical indoor pollutants to keep in mind
Key concerns include PM2.5/PM10, general particles like dust and pollen, and formaldehyde (HCHO) that can off‑gas from new furniture or renovations.
- Local triggers: haze, traffic particulates, high occupancy and sealed rooms with air-conditioning.
- Reality check: “no smell” does not equal clean air; monitors reveal hidden rises in pollutant levels.
- Practical example: a busy conference room can feel comfortable yet build up particles during long meetings.
| Pollutant | Detectable by senses | Source |
|---|---|---|
| PM2.5 | No | Traffic, haze, indoor cooking |
| Dust & pollen | Sometimes (visible) | People, ventilation, open windows |
| Formaldehyde (HCHO) | No | New furniture, renovation materials |
Checks link us to correct sizing and sensible use. They help ensure we are not under‑protecting households or staff. For a practical routine and more steps, see our deep cleaning checklist.
Know the key ratings before we test: CADR, CCM, noise and energy efficiency
We begin by explaining the labels that matter so our tests mean something. Manufacturers list figures such as CADR and CCM; each tells a different story about speed, longevity and daily use.

Clean Air Delivery Rate and what it measures in a room
CADR is a simple speed metric. It shows how fast a device reduces particle levels under defined lab conditions.
That means CADR captures short-term removal, not how filters behave as they load up. We use the clean air delivery and air delivery rate figures to estimate time-to-clean for a given room size.
Cumulative Clean Mass for long-term stability
CCM measures total load capacity until the CADR drops below half its first value. It is the long-haul counterpart to the quick delivery rate number.
For more on CCM testing and why it matters over months of use, see this detailed note on long-term metrics: measure CCM and long-term capacity.
CCM categories and what higher P and F levels mean
| Metric | Category | Range (mg) |
|---|---|---|
| Particles | P1 | 3000–5000 |
| Particles | P2 | 5000–8000 |
| Particles | P3 | 8000–12000 |
| Particles | P4 | >12000 |
| Formaldehyde | F1 | 300–600 |
| Formaldehyde | F2 | 600–1000 |
| Formaldehyde | F3 | 1000–1500 |
| Formaldehyde | F4 | >1500 |
Why noise and energy efficiency affect everyday use
Noise and cleaning energy efficiency shape how people actually run a device. If noise levels are high, we will lower fan speed or switch units off. That reduces real-world benefit.
Simple upkeep matters too. Regular cleaning extends useful life; for practical tips on maintenance we link to a step-by-step guide: how to clean a unit effectively.
Takeaway: pair the CADR and the CCM rating when deciding on sizing. Consider noise and running costs so our real use matches lab claims.
Preparing for an air purifier performance check
Good results begin with practical preparation: fit the device to the room and pick a realistic test spot. A short, repeatable protocol gives us confidence that any change in readings comes from the unit and not from variations in the room.
Right‑sizing and choosing the test location
Right‑size first. We compare the stated coverage or CADR against the room dimensions. An undersized unit will struggle to move enough air and will not show meaningful change.
Choose a sensible location that represents typical use, for example the bedroom centre or the meeting‑room zone, not tucked behind furniture.
Placement and airflow basics
Leave clearance around intakes and outlets. Avoid corners and keep the unit away from curtains or cabinets that block flow.
The fan setting matters. High fan speeds speed results, while “auto” modes can vary and complicate repeatability.
Creating a fair baseline
Baseline‑then‑on is our standard: take baseline readings with the unit off, then run it with doors and windows closed. Keep occupancy stable and avoid new pollutant sources mid‑test.
- Use consistent settings and time periods so results compare week‑to‑week.
- Prepare well to avoid misdiagnosing a healthy unit due to poor placement or inconsistent setup.
Fast at-home checks: airflow, noise levels and filter condition
Quick, hands‑on functional tests help us spot common faults without specialised gear. Start with a calm room and consistent settings so results are repeatable.
Airflow at the outlet
Hold your hand a short distance from the outlet and confirm the fan moves air on each speed. Each setting should feel distinctly stronger or weaker.
If output is weak across all speeds, the fan may be blocked or the filter seating is poor.
Noise as a diagnostic clue
Unusual noise tells a story. Rising noise often means resistance from dirty filters; rattles suggest loose parts.
| Descriptor | Example | Action |
|---|---|---|
| Whisper‑quiet | Bedroom friendly (~30–35 dBA) | Use at night |
| Normal | Conversation level (~45–55 dBA) | Daytime use |
| Loud/rattling | Above 60 dBA or odd sounds | Inspect filters and service |
Filter inspection and indicators
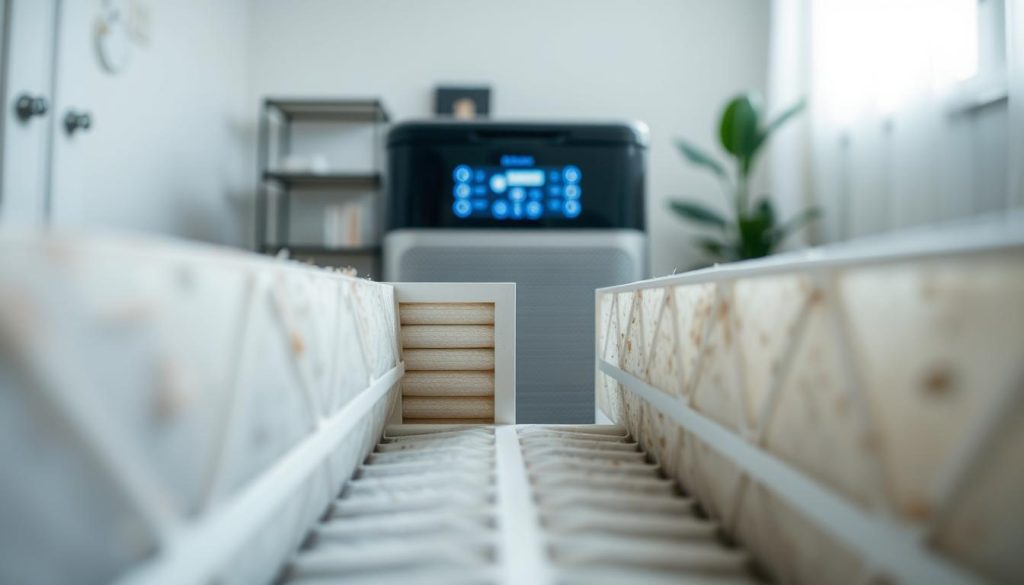
Power down, remove the pre-filter and main filter, and look for discolouration, black spots or physical damage. Poor seating allows bypass leaks.
Note: indicator lights are usually timers. High pollution or heavy occupancy can force earlier replacement than the lamp suggests.
Decision rules: clean pre-filters monthly, replace main filter when visibly loaded or when airflow/noise degrades, and arrange professional service for persistent rattles or weak flow.
Measuring real-world air quality improvements with a monitor and repeatable testing
We validate claims by measuring actual changes in indoor conditions with a simple, repeatable protocol. Start by recording a baseline with the unit off, doors and windows closed, and occupants steady.
Baseline-then-on method
Step 1: log 10–15 minutes of baseline readings.
Step 2: run the unit at a fixed fan speed and record at consistent intervals (for example, 0, 15, 30, 60 minutes).
Which metrics to track
Focus on PM2.5, PM10 and particle counts for particulates. Add HCHO for formaldehyde concerns, TVOC as a broad chemical marker, and CO2 to flag ventilation or occupancy issues.
Monitor placement and time expectations
Place the monitor in the breathing zone where people sit or sleep, away from the outlet so results are meaningful. Expect visible improvement in smaller spaces within ~30 minutes; larger rooms may take a few hours to stabilise.
Optional smoke testing and a simple schedule
Smoke tests show particle removal speed but do not demonstrate gas capture. For a home example, run 10–15 minutes baseline, 60 minutes at max, then repeat at lower speed to balance noise and quality.
Tip: use an independent device and follow this guide on how to test a monitor for best validation: testing an air quality monitor.
Conclusion
, We end by turning technical ratings into a simple habit we can repeat each month.
Start with CADR and CCM to judge speed and long‑term capacity. Then prepare the room, log a baseline and run the unit with consistent settings.
Use quick physical checks — airflow, unusual noise and the state of filters — before assuming failure. If output is weak or noise rises, inspect seating and replace or clean parts first.
Good results are measurable: visible drops in PM readings within a sensible window while noise and energy use remain tolerable. For Singapore homes and small offices, favour units that deliver clean air sustainably.
Monthly checklist: confirm settings, inspect filters, repeat the baseline‑then‑on routine and record results. Adjust placement and operating hours based on measured outcomes, not impressions.

